THERE IS NOW A QUICK AND ACCURATE WAY TO CHOOSE BOOM SUBURBS
PROMOTED BY HOTSPOTCENTRAL.COM.AU
By Michael Fuller, Hotspotcentral.com.au
Recently, we explained how six year old Olivia picked her 2014 investment hotspots, that two years later had grown in value on average 40.97% for houses and 32.82% for units, and shared a free Cheat-Sheet: ‘8 Signs A Suburb’s Property Prices Are Set To Soar’.
In this article, we will introduce the free technology over 13,970 investors - and little Olivia - have been using to pinpoint the best growth suburbs with remarkable scientific accuracy. We will show you how to access this free tool, and explain how to use it to find investment suburbs that match your budget and strategy. Make sure you also download this free Cheat-Sheet: ‘8 Signs A Suburb’s Property Prices Are Set To Soar’ as it shows you what is behind this technology ... how each suburb in Australia is measured on very objective supply and demand indicators to calculate their 'capital growth score', also known as the DSR BoomScore™
Property data moves first, and media headlines follow.
Look at some of the mining towns in 2015, e.g. Moranbah. Those that responded to data decline late, waiting for media headlines to get them moving, regret it now.
The investor who has the data … tracks it … and responds in time, wins.
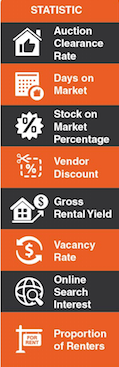
Little Olivia didn’t spend vast time and skill collating these (pictured) 8 property stats to calculate the ratio of demand to supply, and therefore growth potential, for over 30,000 markets (units and houses) to produce her winning suburb predictions. It took her minutes, thanks to a free app, Boomtown.
If a six year old can do it, so can you. Here’s how.
Access boomapp.com.au and select ‘Hotspot Finder’.
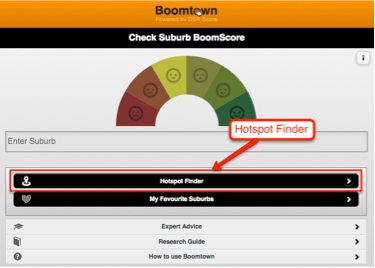
She asked Hotspot Finder for a suburbs list based on (see picture):
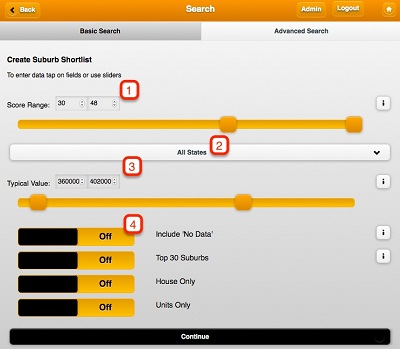
- A DSR (Demand to Supply Ratio) BoomScore™* of 30 to 48, bringing back over 500 results.
She could then have narrowed the search by:
- State or
- price range and/or
- a combination of only houses or only units.
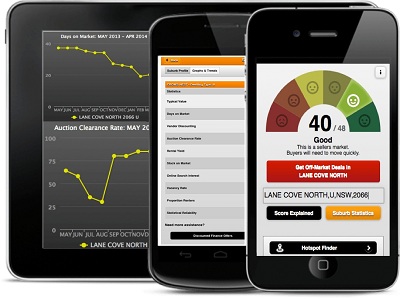
*The BoomScore™ ranks suburbs based on capital growth potential:
- 48 = high probability of imminent capital growth
- 24 = theoretical supply-demand balance
- 0 = high chance of price decline due to over supply/low demand.
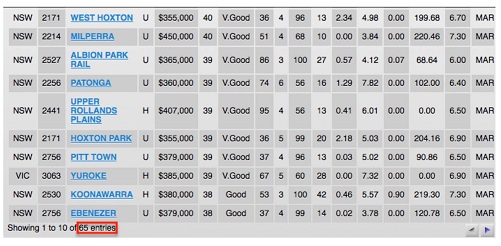
The result was 65 suburbs, sorted by high to low BoomScore.
Her 2014 predictions grew in value by 40% in two years, as audited by an independent data analytics company.
Get your FREE Cheat-Sheet on how to:
- find the 8 proven indicators of growth potential
- analyse this reliable data with ease
- understand the ideal scores for each statistic
- choose top locations from 15,000+ suburbs.
But … what’s the point of getting an average 30% or 40% growth in median values across 50 suburbs? You’d have to own every house in all 50 suburbs. With limited funds, shouldn’t you buy the best house … at the lowest price … on the best street?
The property data represents the average property in a suburb. If a suburb grows by 20% one year, that means the average price in the suburb increased by 20%. Your property might grow by 30% because it’s better than average.
The magazine lists are great but you still need to be able to pick a suburb that meets YOUR budget and strategy.
Searching the data behind these lists isn’t currently possible, so whittling 50 suburbs down to 10 super suburbs is challenging. Conducting detailed research on 50 suburbs is not practical either.
Unlike Olivia, who generated her list based solely on capital growth potential (overall DSR BoomScore), you might refine your search more.
Say your budget is $700,000 to buy, renovate and sell to an owner-occupier. You would still use Boomtown to search 15,000+ suburbs.
You could choose a particular locality if you would like to be nearby, e.g. check stats on 10 suburbs within 20 kms of you.
You’d set the ‘Hotspot Finder Advanced Search’ like this:
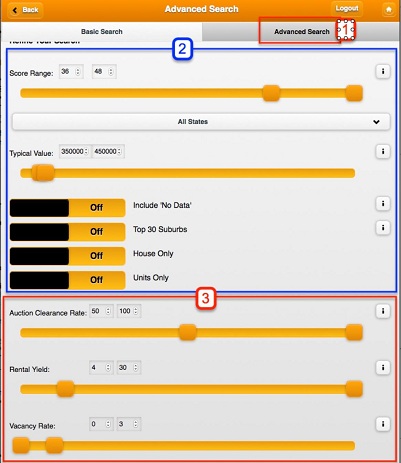
- Choose advanced search
- Apply filters for state, price range, units or houses.
- Customise the search by statistic:
- Days on Market – properties should be selling quickly, so you can too.
- Stock on Market – there must be good stock available (and high demand) so you can find a renovation property.
- Vendor Discount – should be low so you don't have to discount to sell.
- Online Search Interest – lots of people should be searching to buy in this area.
- Renters vs. Owners – good levels of owner-occupiers – your target.
Your search could filter out 80% of suburbs that might make the top 50 on capital growth potential. You would then manually compare the remaining suburbs and choose the best to meet your strategy.
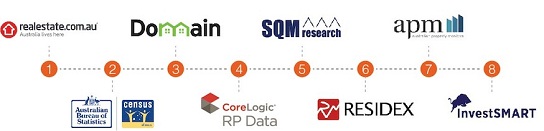
In 10 minutes, you would have checked data from multiple internet sources including Domain.com.au and Realestate.com.au … for over 30,000 markets … based on YOUR budget and YOUR strategy.
If your strategy was a basic ‘high capital growth with solid rental yields’ and you were prepared to dig deep into the fundamental capital growth drivers for each suburb, you can be certain you too would beat the market average and its experts.
And to think we’re just talking about these 8 signs a suburb’s property prices are set to soar and a little free app called Boomtown. We’re confident they will change the way you conduct your suburb research for ever!