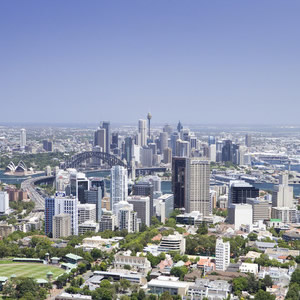
Huge increase in property listings
New data has revealed that property listings in two capital cities rose by more than 20 per cent over the last year, with slow selling times and above average discounts a recurring theme.

Three capital cities have seen listings rise over the past year, and three markets are discounting houses by more than 6 per cent to make sales, according to the latest from CoreLogic RP Data.
Brisbane listings were up 0.1 per cent to 18,015, Adelaide up 1.0 per cent to 7,330, Darwin up 20.1 per cent to 1,565 and Perth up 20.3 per cent to 19,668.
Canberra experienced the biggest decline in listings for the year to 16 August 2015, with numbers down 11.0 per cent to 1,919, according to CoreLogic RP Data.
Hobart listings fell 8.9 per cent to 2,539, Melbourne fell 6.4 per cent to 27,591 and Sydney fell 1.9 per cent to 18,611.
Meanwhile, houses are selling fastest in the boom market of Sydney and taking longest to sell in the bear market of Perth, according to data from 10-16 August.
Sydney’s median time on market is 26 days, with an average vendor discount of 4.1 per cent.
The other highly competitive markets are Melbourne, where houses sell in 31 days at a 4.6 per cent discount, and Canberra, where houses sell in 34 days at a 2.2 per cent discount.
Brisbane houses sell in 63 days at a 5.7 per cent discount, Adelaide houses sell in 64 days at a 5.8 per cent discount and Hobart houses sell in 65 days at a 6.2 per cent discount.
Australia’s weakest markets are Darwin, where houses sell in 82 days at a 7.3 per cent discount, and Perth, where houses sell in 83 days at a 6.4 per cent discount.
Read more:
Where will the APRA changes be felt the most?
Top 10 mistakes during the purchasing process


