What type of buyer are you?
To understand how to choose quality investments, you need to know how buyers, price cycles and developers impact on the market. Let’s look at the different types of buyers and how their purchasing patterns affect market movements and price cycles.

Blogger: Cam McLellan, director, OpenCorp
The property market comprises three purchasing groups by sales volume:
- First home buyer: 20 per cent
- Relocator (upgrader or downgrader): 50 per cent
- Investor: 30 per cent
First home buyer (FHB)
FHBs seek an entry-level home. They want to leave their parents’ home or stop renting. FHBs buy at sub-median prices and may want to start a family. They have minimal assets and limited capital. FHBs are highly sensitive to interest rate movements. They’re also scared of missing out on the ‘great Australian dream’. They buy on emotion, panic when prices rise. FHBs push prices up from the bottom of the market. The price growth cycle is typically started by FHBs as the government provides incentives to them to invigorate a market.
Relocator/ Owner occupier (upgrader or downgrader)
Relocators seek a specific type of property: something bigger, smaller, better, closer to work or in a nicer suburb. They must sell their home for a good price and so need active FHBs in the market to push prices up. Relocators buy on emotion and pay more for a house that meets their needs. Relocators own property at the top end of the market, so when they get active they draw prices up as they buy above the median price point.
Investor
Investors want to make money. They won’t compete on price and, in theory, should never buy at auction. They want to get in before prices boom and their target price will be sub-median (as with FHBs). Investors like to buy at low interest rates. But they’re not as ‘twitchy’ as FHBs as rents often rise at the same time to offset the impact. Investors don’t push prices up, but they absorb excess stock. This increases the urgency of FHBs to get into the market before they miss out.
Each group has a different motivation; it’s important to know what drives their decisions. Sydney and Melbourne have about twice the sales of Brisbane and Perth. When investors move from a larger market to a smaller one, the demand pressure can invigorate the smaller market as investors soak up excess stock. Once investors have made money from a growth cycle, they want to take advantage of the increased equity in their properties. If the local market is starting to ease and shift into a slow growth phase, they won’t be keen to invest there. So they start looking at other markets where the short-term growth prospects may be more attractive.
Developer
When looking at factors affecting supply and demand in different markets, one thing people fail to consider is developer activity. It’s vital you understand the massive impact developers have when you’re assessing potential markets. Two main types of developers interest us: medium- and high-rise apartment block developers and broadacre land subdividers. Other developers, such as infill town house and dual occupancy developers (recreational developers), don’t influence the market as much as major developers.
Here are the steps in the development process:
- feasibility and due diligence
- acquisition
- design
- planning approval
- presales
- construction
- settlement (when the resident can move into the dwelling)
Apartment development takes up to three years from concept to end product. Land subdivision and build takes two to three years. I’m talking large apartment blocks (100+ dwellings) and larger land developments (200+ lots). Look at the Open Corporation developer’s activity chain diagram Matt and I developed. The activity it outlines affects the supply of properties, which dictates price movement.
This diagram will help you understand why the market cycles, rather than growing evenly each year. This is a good concept to grasp, as it shows there’s only a very small time window when it’s not advisable to invest in a particular market.
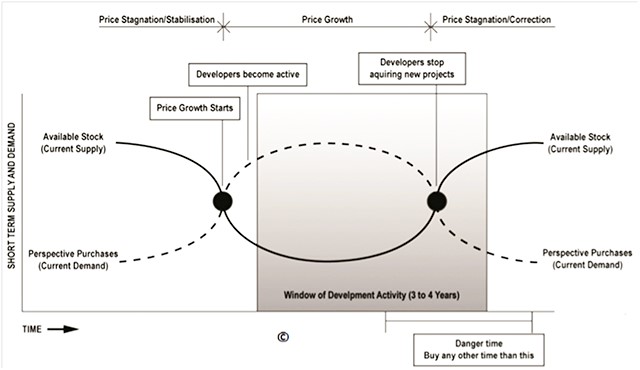
As you study the diagram, focus on the supply and demand lines. You’ll see that up to the point where demand exceeds supply, prices have stabilised, corrected or become stagnant. Investors then start to buy excess stock. When price growth begins, developers see opportunities to make profits again and start buying and delivering stock to the market (this is the shaded part of the diagram). A large-scale development can take years to bring to market. During this time, a shortage of dwelling stock causes further price growth. This is often when a boom occurs.
Unfortunately, most developers don’t get active until they see the boom start. And, given it takes two or three years for their projects to deliver new supply to the market, most development stock is ready after the boom. This leads to oversupply, as stock can keep coming onto the market for up to 18 months after the boom ends.
This is why prices stagnate or correct/fall, then don’t pick up again until the excess supply has been soaked up. Typically, when demand drops below supply, large-scale developers stop acquiring new projects. The market clock example below shows how the real estate market cycle is ongoing. You need to view each city market individually because it moves through each stage at different times. I view the four major cities as eight markets: four residential and four commercial. The clock shows only residential markets. I’ve indicated the danger time for investors, when you should not invest.
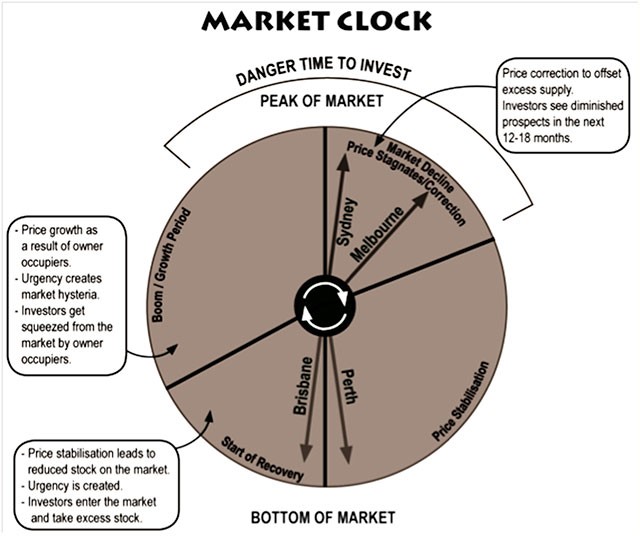
As we know, property prices don’t rise by 8.7 per cent every year. The market generally follows these cycles over 7 to 10 years when you invest in a growth area. The market may have stagnation and price correction after a period of high growth. But prices recover and boom again. Then you see large price increases over a short time. This is when things get really exciting if you’re holding a substantial portfolio.
Once you know how to determine the current position of each market accurately and which ones aren’t worthy of investment at that time, you can choose a market with good growth potential. The faster you achieve growth, the faster you can duplicate. I’m not giving you a crystal ball. But I am showing you how to understand the market and make informed investment decisions.
Remember, there’s only a relatively short time in the market’s entire cycle when prices may correct and decrease until excess stock is bought. People who wait to buy and try to pick a slight market downturn are playing seriously bad odds. Don’t be put off by the real estate cycle. Booms and dips come and go. Both are expected and neither lasts forever. You’re not a trader; you’re an investor with a long-term strategy. That means you buy, hold, buy, hold, buy and hold.
So when’s the right time to buy? I once asked this of a wise man. His answer: “20 years ago.” And the next best time? “As soon as you can afford a deposit.” Cheers, Steve, that was the best tip a rookie investor could ever get!
Note the 12 to 18 months after a market has experienced significant growth, when prices stagnate or correct. This is the only time we don’t invest. After a market has had years of strong growth, look to other cities. Choosing the right time to buy is actually fairly simple, once you understand this concept.
Tips
- Understand the different types of buyers and the effect their activity has on the market.
- When is the right time to buy? As soon as you can afford a deposit.
- The danger time for buying into a market is during a late boom, stagnation or price-correction period.
- Understand the time it takes developers to bring product to market.
- After every high growth period, you can expect a market stagnation or correction as supply exceeds demand.
Want to see more stories from trusted news sources?
Make Smart Property Investment a preferred news source on Google.
Click here to add Smart Property Investment as a preferred news source.