Capital cities break price growth records

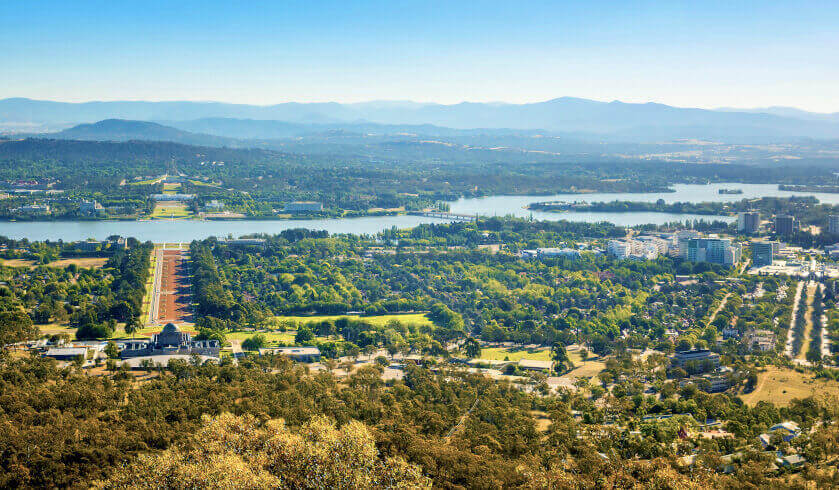
Over the June 2021 quarter, Canberra saw a 10.4 per cent increase in house prices — the only capital city to see double-digit price growth over the said period.
This constitutes a daily increase of almost $1,054 over the past three months, or a total rise of $96,000, making it the steepest price acceleration in the capital city in almost 30 years.
But Canberra is not the only capital city breaking records, according to Domain.
Sydney’s twice-consecutive price growth of 8 per cent was deemed a “rare growth only seen three times over the past 30 years”, while its annual rise at 24 per cent exceeded the boom-time results of 2015 and 2002.
Hobart has also exceeded its own boom-time record in 2017–18 and saw its steepest annual increase in 17 years, with house prices hitting a new record at $643,301.
Meanwhile, Melbourne produced three quarters of consecutive growth above 4 per cent for the first time since the city’s post-GFC rebound — the city’s strongest annual increase in 11 years.
Brisbane also broke a 13-year record with its annual increase of 13 per cent, with upgrading home owners fuelling house prices. This growth rate brings all Brisbane regions to record-high prices, albeit Ipswich and Logan-Beaudesert.
Similarly, Perth recorded its strongest annual increase in 11 years, with house price reaching a six-year high over the June quarter — supported by internal migration into Greater Perth, which is currently the highest level since 2013. The WA capital also saw its busiest June quarter since 2014 for houses and units based on properties sold.
Adelaide, meanwhile, has surpassed the $600,000-mark for the first time, marking the city’s “strongest growth period since late 2007”. The strength of buyer demand has also resulted in the highest volume of sales transactions ever recorded for the SA capital, for both houses and units.
Finally, Darwin’s house prices have now reached the highest point in almost four years. Although the current median remains lower than the late-2013 peak, the price gap has been rapidly closing, with Domain predicting that the capital city will ultimately surpass its peak by early 2022.
Looking ahead, Domain said population growth, jobs and economic growth would be crucial for the sustainability of the property market rebound.
|
Quarter-on-quarter |
Year-on-year
Loading form...
|
|
|
Canberra |
10.4% |
29.2% |
|
Sydney |
8.2% |
24.0% |
|
Melbourne |
4.1% |
16.2% |
|
Brisbane |
5.0% |
13.0% |
|
Adelaide |
5.4% |
16.3% |
|
Perth |
1.0% |
12.3% |
|
Hobart |
6.6% |
28.4% |
|
Darwin |
8.9% |
22.3% |
|
National |
5.8 |
18.8% Tags:
You need to be a member to post comments. Become a member for free today!
More from this writer: |
