 Login
Login


Brisbane property market update for September 2023
The end of the third quarter further solidified the recovery phase in property price growth across Greater Brisbane.
Brisbane seems set to reach a new record high in October, with property values now just 0.6 per cent below their previous peak according to CoreLogic data. Since January, prices have soared 9.1 per cent throughout Brisbane, an astonishing performance given the higher inflation and interest rate environment.
With just under half of the growth since the beginning of the year occurring in the last three months, it appears that the pause in the interest rate cycle may have had a positive effect on boosting buyer confidence in Brisbane. With the Reserve Bank of Australia holding the cash rate at 4.1 per cent for the third consecutive month in September, it seems buyers are more confident to price in the cost of borrowing, knowing that we may be at, or close to, the peak.
Brisbane is the second most affordable capital city market in Australia, behind Perth. According to the PropTrack Housing Affordability Index, across all of Queensland, housing affordability is more favourable today than it was in 2007–08 when the mining boom drove strong demand for housing amid higher mortgage rates than today. Housing affordability across the state of Queensland has become tougher in the last two years, however compared to other east coast capital cities, relative affordability is still a big driver of demand for housing in and around the city of Brisbane.

According to PropTrack data, an average of 31 per cent of income is required to service a mortgage in Queensland. This is compared to 39 per cent in NSW and 35 per cent in Victoria, South Australia and Tasmania. This makes Brisbane a very attractive destination, especially for cross-border property investors looking for a low-risk investment option.
This might partly explain the jump in the proportion of investors who make up housing finance commitments in Queensland. ABS data has confirmed that investor activity increased to 37.8 per cent of all housing finance commitments throughout August, up from 34.7 per cent the previous month.
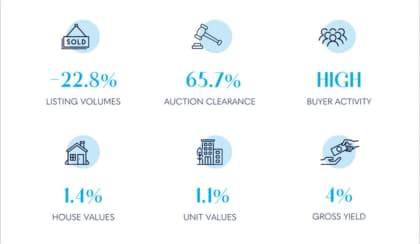
Buyer demand continues to outstrip supply in many suburbs across Brisbane. New listings remained frustratingly low between July and August. According to SQM Research, new listings declined -0.57 per cent month on month and total listings declined -0.24 per cent. CoreLogic data also confirms that new listings in Brisbane are -13.3 per cent lower than this time last year, and total listings are -22.8 per cent lower. Choice for buyers in Brisbane remains much lower that what has been typical over the past decade, with listings still trending approximately 40 per cent below the long-term average according to CoreLogic.
The PropTrack Listings Report confirmed that the suburb trends can often be different to the overall city-wide trend for listing volumes. Suburbs where year-of-year listings have significantly increased include Park Ridge (+142 per cent), Ripley (+140 per cent) and Ormiston (+79 per cent), whereas suburbs with the greatest decrease include Cornubia (-58 per cent), Warner (-57 per cent) and Woolloongabba (-52 per cent). This can often dictate more local supply metrics, which need to be considered alongside the local levels of demand to determine the price pressure at a more local level.
Auction results throughout September softened slightly in Brisbane according to Apollo auctions, with an average clearance rate of 65.7 per cent, down from 68 per cent last month. The number of registered bidders also slipped slightly from 3.8 in August, to 3.5 in September. However, the percentage of active bidders remained relatively stable with 63.7 per cent of registered bidders actually raising their paddle. This may indicate that the peak rate of buyer activity is starting to pass, but it might also be a seasonal trend due to two of the weeks in September falling within school holidays.
Brisbane Dwelling Values
Throughout September, Brisbane dwelling values increased a further 1.3 per cent taking the median value to $761,739. Across the quarter, Brisbane dwelling values increased 3.9 per cent. Last month the quarterly growth was tracking at 4.2 per cent, which indicated that the peak rate of growth for Brisbane dwellings might have passed.

Free investor loan check
Better property decisions start with smarter lending.
A free 15-minute finance check for property investors.
What are your lending goals?
Choose a goal to request a callback.
Ready to talk?
Book a 15-minute call →Finni Pty Ltd · Australian Credit Licence 384324 · Privacy
Source: CoreLogic
Positive dwelling price growth across September has also been confirmed by PropTrack data, which demonstrated 0.39 per cent growth in Brisbane for the month. This is a slight increase from last month’s growth for dwellings which was at 0.27 per cent.

Source: PropTrack
Brisbane House Prices
CoreLogic data demonstrated another strong month of median price growth for Brisbane houses with a further 1.4 per cent growth across the month. This equates to a median house value of $848,680, which is $16,433 more than last month. When you consider this growth on a weekly basis, it is approximately $4,108 of price growth per week.
Brisbane houses have grown 4 per cent across the quarter, which is down slightly from last month when quarterly growth for houses was 4.3 per cent. This indicates that the peak rate of growth for houses in Brisbane may also have passed.

Source: CoreLogic
House prices, according to PropTrack data, increased 0.33 per cent in Brisbane throughout September. This has also been reported as a higher rate of growth than last month, which was 0.27 per cent.

Source: PropTrack
Brisbane Unit Prices
CoreLogic data showed unit values in Brisbane increased a further 1.1 per cent in September, which is the same rate of growth as last month. Quarterly unit price growth is currently 3.7 per cent, which is slightly lower than last month at 3.8 per cent. The median value of a unit in Greater Brisbane is now $539,169, which is $13,010 over the month or approximately $3,252,50 of price growth every week.

Source: CoreLogic
According to PropTrack data, unit values increased 0.76 per cent throughout September which was a much stronger result than August where growth was reported at 0.32 per cent.

Source: PropTrack
Brisbane Rental Market
Vacancy rates in Brisbane remain consistently low. They dropped again according to SQM Research from 1 per cent in July to 0.9 per cent in August. Most regions of the city are showing very tight vacancy at the moment.
Rents are still increasing, however the rate of rental price growth has slowed down a lot over the last quarter.
House rents have shown a 6.4 per cent increase over the last 12 months, whereas six months ago at the end of March 2023, the annual rent price growth for houses in Brisbane was 11.2 per cent. This slowdown in the rate of rent price growth is likely due to affordability constraints, even despite the lower vacancy rates. There is also the possibility that we are starting to see a structural change in household formation as group rentals re-form in an effort to spread rental costs across a larger household size.
Unit rents are up 14 per cent in Brisbane over the last 12 months according to CoreLogic. Six months ago, this was tracking at 16.1 per cent, so whilst the rate of growth has also slowed slightly, units being the more affordable section of the market appear to have outperformed houses in terms of rental price growth.

Source: CoreLogic
Queensland Rent Law Reforms came into effect on 1 September, whereby minimum housing standards have been introduced for all new tenancies entered into after this date, so landlords need to ensure their rental properties are compliant.
The PIPA Annual Investor Sentiment Survey revealed 23 per cent of investors who sold a property in the last 12 months, sold out of Brisbane. Whilst this survey revealed that rising interest rates were one of the reasons they sold out of the market, a larger majority indicated that their sale was due to changing tenancy legislation as well as increasing levels of government legislation making property a less attractive investment to hold. The net result has been a shrinking volume of investment properties in the Brisbane market, which will ultimately put more strain on tenants as they compete for a lower volume of available rentals.
Summary
It is apparent that buyer confidence is up in Brisbane, but unfortunately the choice that buyers have, in terms of properties available for sale, remains tight.
Despite the rapid median price falls throughout the latter months of 2022, it appears that Brisbane has regained most of these price adjustments throughout 2023. This growth has been driven by strong migration, tight rental markets and a housing shortage.
As we head into October, it is expected that Brisbane property prices will reach a new peak in the weeks ahead. Property prices are continuing to rise at a fast pace in Brisbane, and there appears to be little evidence of more supply coming to the market at this stage.
For buyers, expect high levels of competition, and be ready to act fast because good properties are again selling very quickly. For sellers, it might be a good time to list! There are a lot of buyers ready to transact, and the competition is putting strong pressure on prices. These conditions are likely to continue to support price growth over the medium term.
Melinda Jennison is the Real Estate Buyers Agents Association of Australia (REBAA) president and the managing director of Streamline Property Buyers.
Want to see more stories from trusted news sources?
Make Smart Property Investment a preferred news source on Google.
Click here to add Smart Property Investment as a preferred news source.