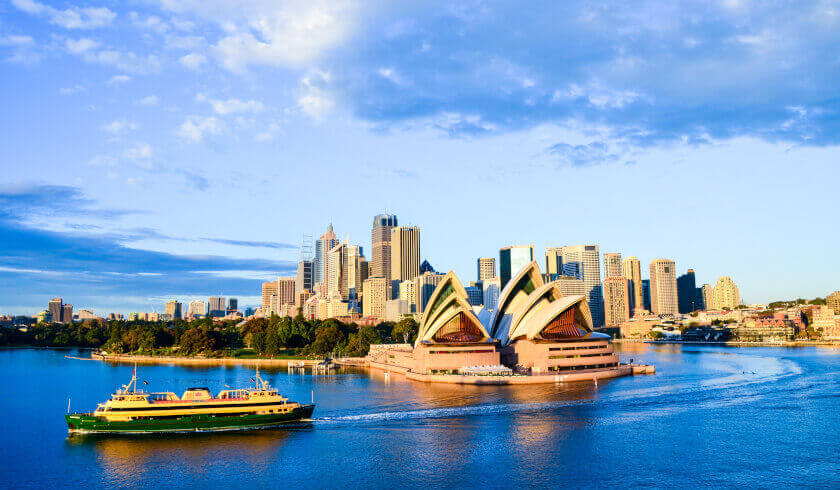
How Sydney's affordability compares to the rest of the world
Housing affordability is an issue for Australians, but new data shows that, at least for the apartment market, Sydney property is well below the most unaffordable locations around the world.
The 2019 Neighbourhood Price Index, released by Nestpick, has revealed the top locations around the world for rental unaffordability, and Sydney does not fall in the top five, ten, fifteen, or even 20.
Sydney falls right at the halfway mark on the index at 25 out of 50, with an overall percentage of disposable income required to pay rent at 51.77 per cent.
When examining Sydney by its different regions, the first instance of a Sydney location is the CBD, which falls in at 128 out of 740.
However, Ömer Küçükdere, managing director at Nestpick, said the costs are relative to earnings, as the CBD had an inequality percentage of 139 per cent, which the index derived from the percentage deviation from the median price; 100 per cent is the exact median required.
A percentage higher than 100 means renters need to pay more than the city-wide median, while under 100 means renters pay less than the city-wide median.
“For somebody on minimum wage, it would take their entire monthly salary just to pay for rent alone in the Central Business District of Sydney,” Mr Küçükdere said.
“This hints that those living in that area are on much higher salaries than the average, and it's likely that landlords are simply reacting to supply and demand.”
Following the CBD was:
- the Eastern Suburbs at position 259 with an inequality percentage of 110 per cent,
- the Northern Beaches at position 327 with an inequality percentage of 97 per cent,
- the Inner West at position 341 with an inequality percentage of 98 per cent,
- St. George at position 392 with an inequality percentage of 93 per cent,
- the Hills District at position 400 with an inequality percentage of 88.5 per cent,
- the Northern Suburbs at position 439 with an inequality percentage of 84 per cent,
- the combined Canterbury-Bankstown areas at position 515 with an inequality percentage of 68 per cent,
- Macarthur at position 555 with an inequality percentage of 62 per cent,
- South-western Sydney at position 556 with an inequality percentage of 62 per cent, and
- Western Sydney at position 574 with an inequality percentage of 63 per cent.
By comparison, the city of London was ranked first with an inequality percentage of 163.96 per cent.
“As companies and cities battle to attract a highly skilled workforce, the reality of disposable income and cost of living has become more important than mere salary alone,” Mr Küçükdere said.
“A byproduct of this data has been that we’ve confirmed the gap of inequality that exists within certain cities. In some cases, an individual working on minimum wage might need to work over 500 hours just to afford one month’s rent in a particular neighbourhood.”
Mr Küçükdere added one takeaway from the study is that the saleries required to live in many of the most popular neighbourhoods are above the average wage of the cities they are located.
“Take cities like San Francisco where employees, especially those in tech, are earning very high salaries but still need to live hours away from work due to the exorbitant rent prices,” Mr Küçükdere said.
“Although this is being tackled creatively with company commuting buses, for example, more needs to be done to tackle the disparity between rent and salaries if we want to halt this alarming trend from affecting more cities around the world.”
Want to see more stories from trusted news sources?
Make Smart Property Investment a preferred news source on Google.
Click here to add Smart Property Investment as a preferred news source.
