Queensland tipped to win interstate migration State of Origin
With Origin kicking off, taking the time to look at how footy teams and migration statistics relate could help you pick a viable hotspot with high-growth prospects.

Buyers’ agency Propertyology has noticed a correlation between migration statistics and various footy teams from different codes over the last 17 years.
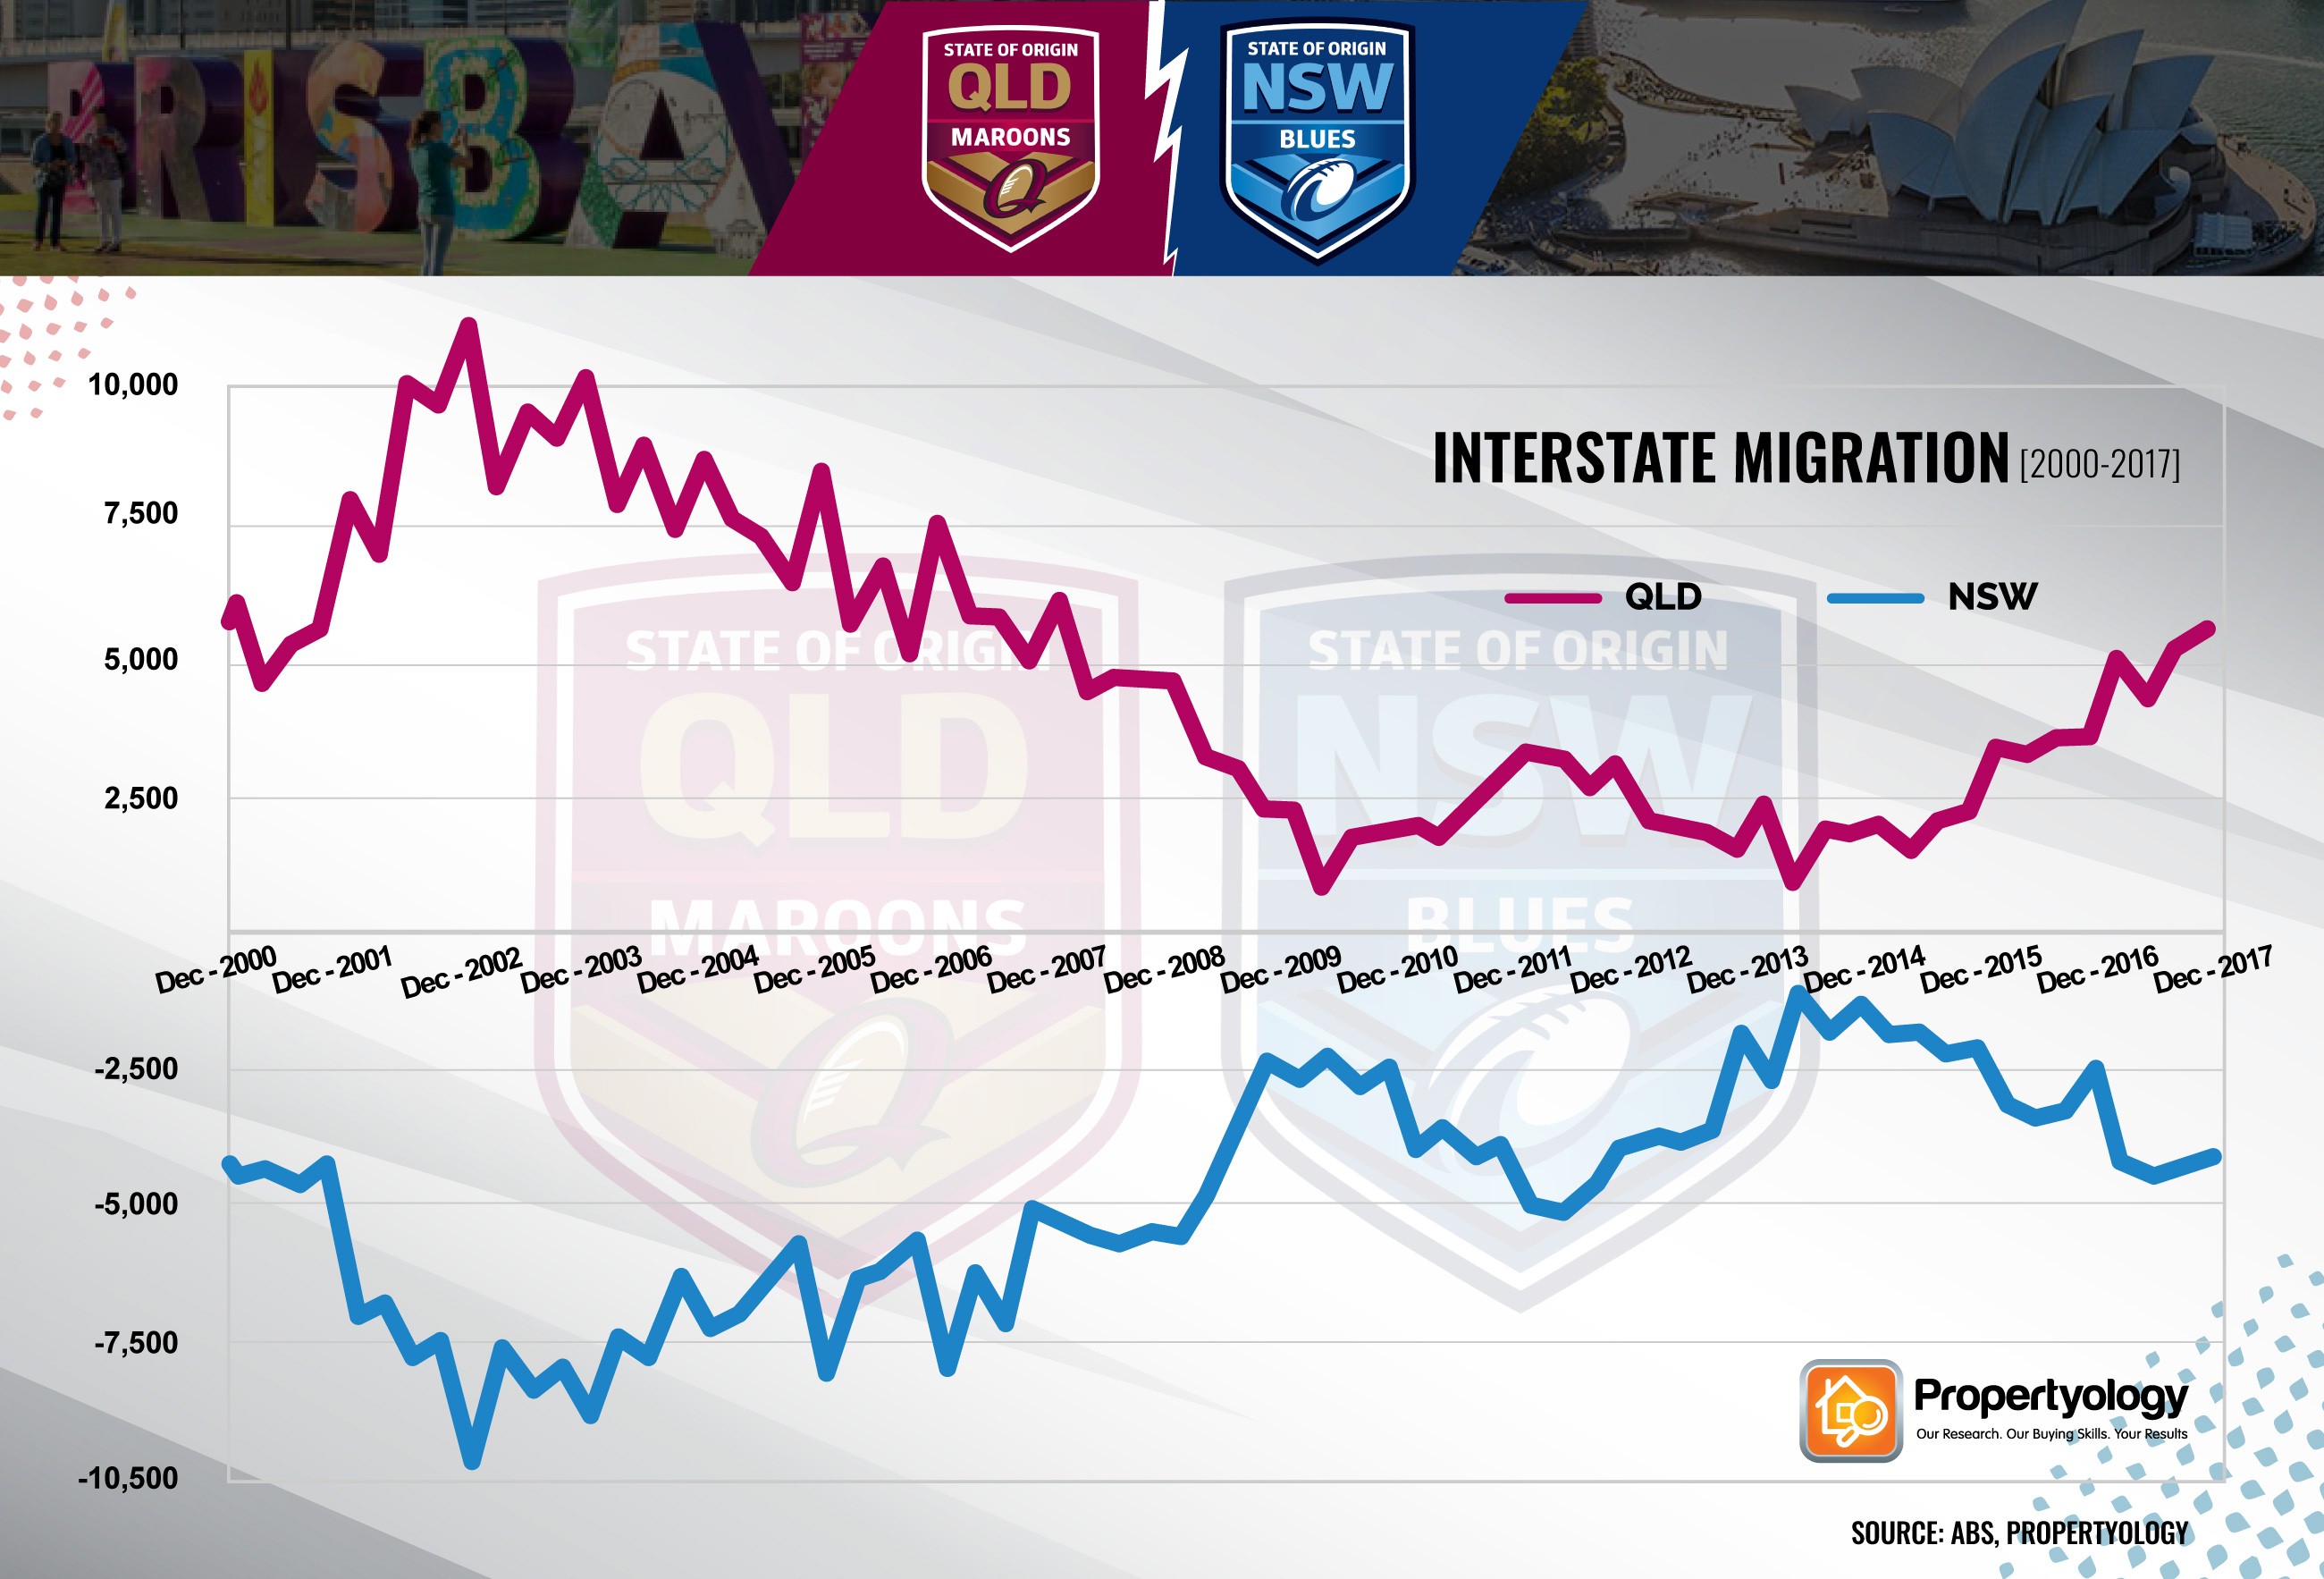
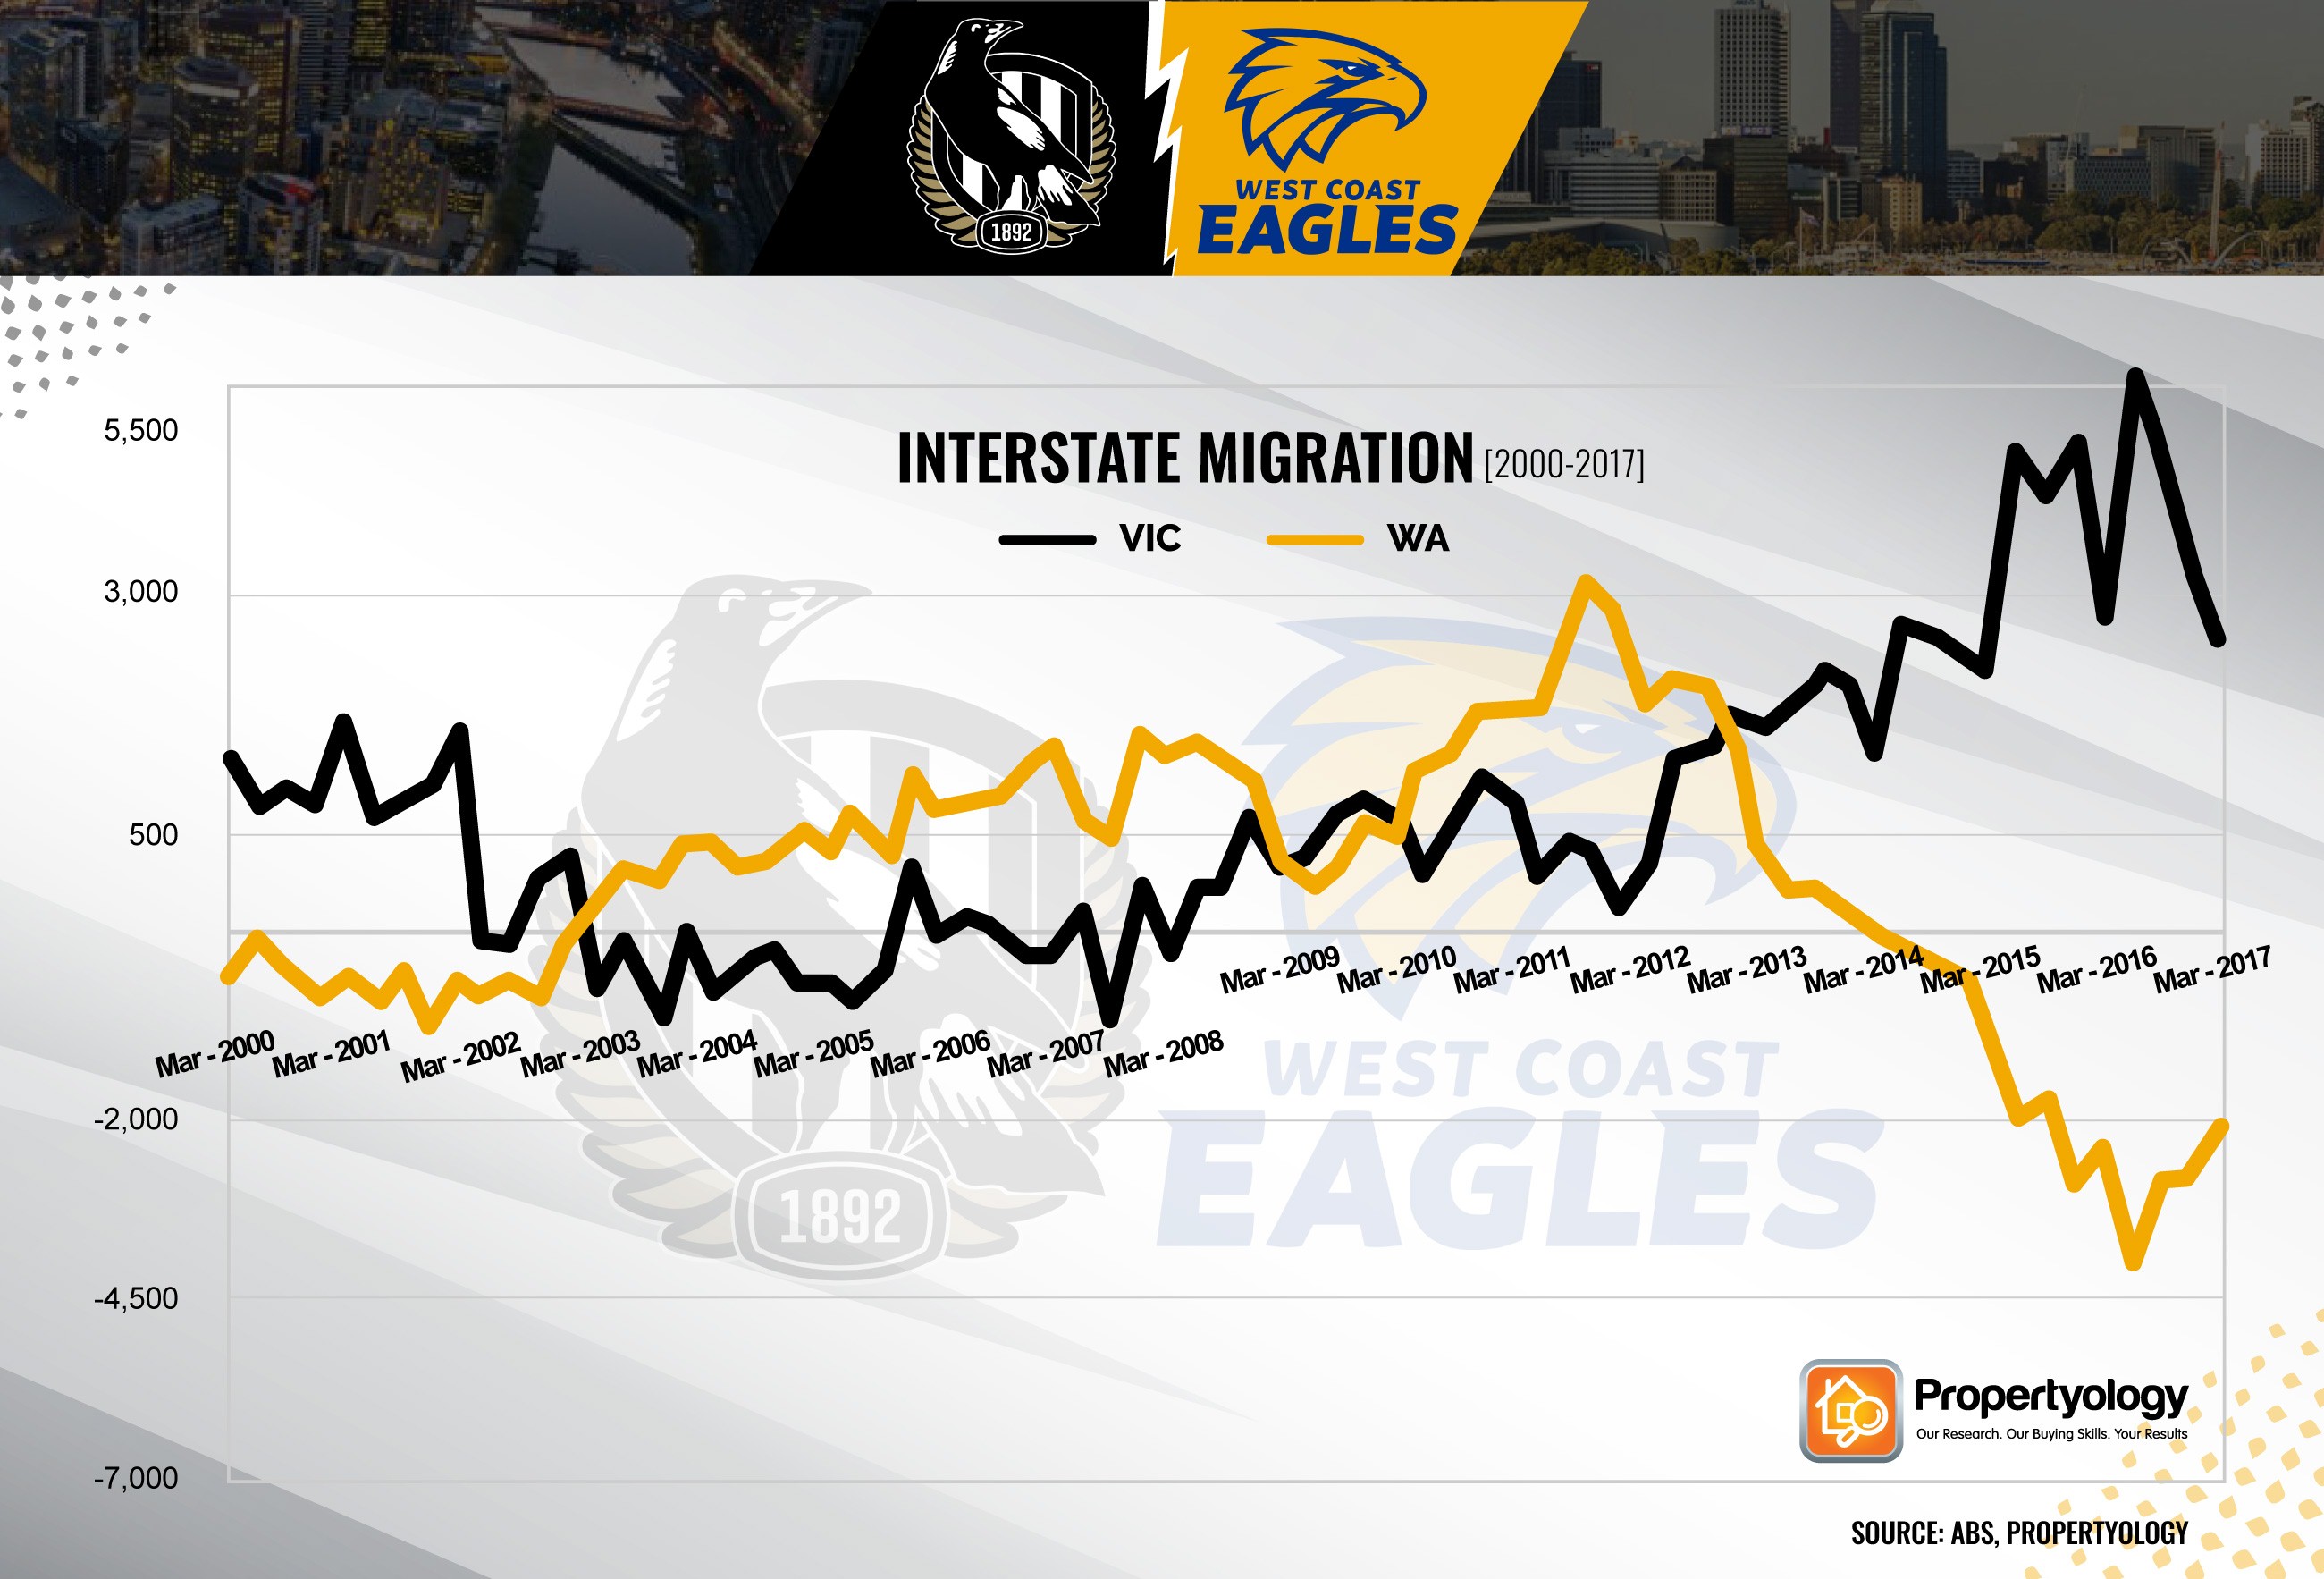
The analysis paired NSW and Queensland and Victoria and Western Australia, and revealed that over the last 17 years, the instate migration statistics initially were a mirror image; where one state saw a rise, the other of the pair saw a decline of an approximately comparable move.
Simon Pressley, Propertyology head of research and managing director, said that when people looked to move interstate, they look for a sense of familiarity when they do.
“People don’t make a conscious decision to pack up and move cities very often. When they do, the dinner table discussion often revolves around how and where they will find work, housing affordability, and lifestyle,” Mr Pressley said.
“It’s that lifestyle component that appears to create a strong cultural connection between Queensland and NSW, and Victoria and Western Australia.
“Sport has always been a key part of Australian lifestyles and the dominant footy code for each state clearly affects household decisions when relocating.”
As migration is driven largely by economic factors, Queensland and Western Australia saw high levels of overall population growth before 2012, according to Mr Pressley.
However, post-2012, there was a shift that saw Victoria and NSW take over for overall population growth.
In terms of interstate migration however, Queensland experiences the highest levels of interstate migration according to the most recently available statistics from the Australian Bureau of Statistics, stronger than that of its Origin rival NSW.
“NSW and Queensland have always been dominant rugby league states so as employment opportunities and cost of housing swing, population tends to also swing between those two states at the same time,” Mr Pressley said.
“In fact, the interstate migration comparisons of NSW and Queensland and Western Australian and Victoria is like an inverted mirror when plotted on a graph.”

The reasoning behind Western Australia’s migration fluctuation is more specific, driven largely by big sources of employment.
“Whether migration across the Nullabor is heading left or right tends to be heavily determined by the expansion or contraction of workforce decisions from BHP, Rio Tinto, and Chevron,” Mr Pressley said.
“That means that in 2011 and 2012, Western Australia gained 20,000 people from interstate, yet they lost 20,000 people in 2016 and 2017 as the mining downturn continued.”

