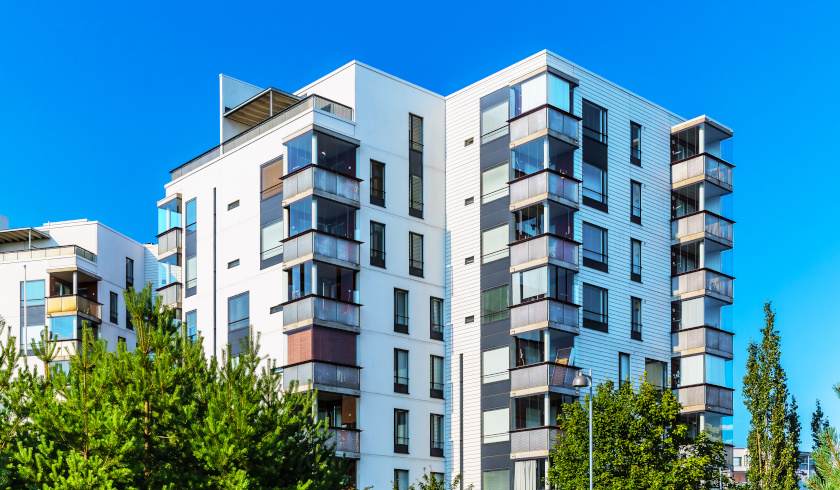
The top 20 suburbs primed for apartment demand revealed
With apartment supply reaching high levels, knowing which areas have the highest density could increase your chances of renting an apartment out faster. Do you own an apartment in one of these areas?

The latest Property Pulse analysis from CoreLogic has revealed the top 20 suburb areas with the highest population density across the country – and they’re all located in Sydney and Melbourne.
Data from CoreLogic shows Australia is in the middle of an apartment construction boom, with nearly 97,000 medium to high density projects completing construction in the last 12 months ending March 2018; that’s 84 per cent higher than the decade average.
Most of these projects are based in inner city areas of Australia’s largest capital cities to meet the demand of increases in population growth.
According to CoreLogic, the suburb with the highest population density is Melbourne; with a population of 45,231 and an area of 2.4 square kilometres, a population density of 19,107 per square metre is a tightly packed area. With a median unit value of $443,681, property is reasonably affordable for investors to meet rental demand.
Taking out second place were the Sydney suburbs of Potts Point and Woolloomooloo, featuring a smaller area of 1.5 kilometres and a population of 23,681, resulting in a population density of 16,220 per square metre, but a significantly higher median unit value of $858,387.
In third place were Pyrmont and Ultimo. Also rocking an area of 1.5 square kilometres and a similar population to Potts Point and Woolloomooloo of 24,118, this third place area has population density of 16,170 per square metre and an even higher median unit value of $929,308.
The first suburb not to be based in Sydney or Melbourne was Kangaroo Point in inner Brisbane, which ranked in at 34 with an area of 1.3 square kilometres, a population of 9,152, a population density of 6,822 per square kilometre and a median unit value of $493,358.
These higher density areas are geared more towards students and typically single people who need to get in and around city centres, the Property Pulse noted.
Important to note is that the most recent population figures come from 2017 ABS data, so these areas could be even more dense than the Corelogic analysis indicates.
The top 20 high population density areas in Australia, according to CoreLogic, are:
|
Rank |
Surburb(s) |
State
Loading form...
|
Area in square kilometres |
Population |
Population density (per square kilometre) |
Median unit value |
|
1 |
Melbourne |
VIC |
2.4 |
45,231 |
19,107 |
$443,861 |
|
2 |
Potts Point - Woolloomooloo |
NSW |
1.5 |
23,681 |
16,220 |
$858,387 |
|
3 |
Pyrmont - Ultimo |
NSW |
1.5 |
24,118 |
16,170 |
$929,308 |
|
4 |
Darlinghurst |
NSW |
0.9 |
12,504 |
14,585 |
$909,109 |
|
5 |
Surry Hills |
NSW |
1.3 |
18,048 |
13,707 |
$848,565 |
|
6 |
Carlton |
VIC |
1.8 |
21,794 |
11,993 |
$361,173 |
|
7 |
Redfern - Chippendale |
NSW |
2.2 |
25,204 |
11,650 |
$911,129 |
|
8 |
Waterloo - Beaconsfield |
NSW |
3.6 |
37,918 |
10,585 |
$896,624 |
|
9 |
Bondi Beach - North Bondi |
NSW |
2.5 |
23,261 |
9,451 |
$1,187,723 |
|
10 |
Glebe - Forest Lodge |
NSW |
2.3 |
21,692 |
9,422 |
$913,340 |
|
11 |
South Yarra - East |
VIC |
2.5 |
23,642 |
9,396 |
$596,614 |
|
12 |
Randwick - North |
NSW |
1.9 |
18,018 |
9,302 |
$917,035 |
|
13 |
Neutral Bay - Kirribilli |
NSW |
2.2 |
19,311 |
8,735 |
$1,048,187 |
|
14 |
Newtown - Camperdown - Darlington |
NSW |
3.3 |
27,627 |
8,418 |
$791,470 |
|
15 |
Kingsford |
NSW |
2 |
16,921 |
8,400 |
$843,197 |
|
16 |
Fitzroy |
VIC |
1.4 |
11,478 |
8,337 |
$729,539 |
|
17 |
Lakemba |
NSW |
2.2 |
18,144 |
8,294 |
$420,236 |
|
18 |
Bondi - Tamarama - Bronte |
NSW |
2.5 |
19,949 |
7,988 |
$1,121,283 |
|
19 |
Wiley Park |
NSW |
1.4 |
10,877 |
7,806 |
$433,952 |
|
20 |
Collingwood |
VIC |
1.3 |
9,824 |
7,758 |
$611,261 Tags:
You need to be a member to post comments. Become a member for free today!
More from this writer: |
