The top 50 regions of growing and declining dwelling value
Growing regions
Detailed in CoreLogic’s Property Pulse report, the results of the CoreLogic Home Value Index shows that regional Victorian and Tasmanian regions were ripe with dwelling value growth over the year to November 2018.
CoreLogic analyst Cameron Kusher said that these regional areas were seeing increased attraction given the market softening across the country (occurring mostly in capital cities).
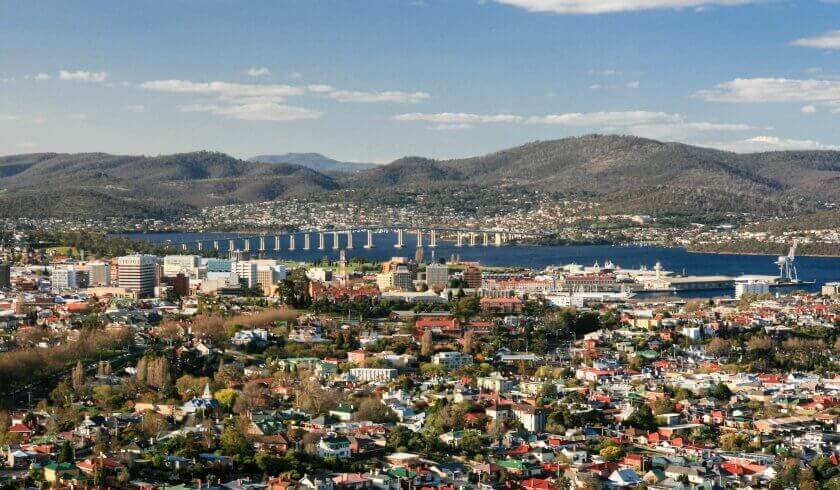
The top spot was taken out by Tasmania’s south-east region, where values rose by 16.3 per cent over the period, the only region in the top 50 list to see a value increase of more than 15 per cent.
Second and third places were also in Tasmania; the Brighton region at 14.8 per cent and North West Hobart at 14.3 per cent.
In fact, out of the top 15 places, 10 were from Tasmania.
Meanwhile, Victoria took out three places and Queensland and NSW had once place each.
Declining regions
Meanwhile, out of the top 50 declining regions, just under half (23) recorded double-digit value declines.
Outback Southern Queensland took out the bottom spot, with a value decline of 15.6 per cent, followed by Far North Queensland (14.5 per cent) and then a tie between the Dural-Wisemans Ferry regions and Pennant Hills-Epping regions, both in NSW (14.2 per cent each).
NSW was featured heavily, with over half of the value decline regions (28) found in the eastern state.
Other declining value regions included Victoria, Queensland, Western Australia and the Northern Territory.
Looking ahead
Mr Kusher said that the outlook for the housing market was one of further weakness adding that he expects more regions to record declines by November 2019.
“More affordable regional housing markets with healthy or improving economic and demographic conditions are expected to hold up better in terms of growth than the more expensive and weaker capital city housing markets,” Mr Kusher said.
Top 50 regions for value growth
|
Region |
Value growth (as a percentage) |
|
South East Coast, Tas |
16.30% |
|
Brighton, Tas |
14.80% |
|
Hobart - North West, Tas |
14.30% |
|
Bowen Basin - North, Qld |
14.00% |
|
Meander Valley - West Tamar, Tas |
13.80% |
|
North East, Tas |
13.70% |
|
Gippsland - South West, Vic |
13.40% |
|
Baw Baw, Vic |
12.60% |
|
Lachlan Valley, NSW |
11.80% |
|
Launceston, Tas |
11.10% |
|
Sorell - Dodges Ferry, Tas |
10.90% |
|
Creswick - Daylesford - Ballan, Vic |
10.80% |
|
Central Highlands (Tas.), Tas |
10.50% |
|
West Coast, Tas |
10.20% |
|
Geelong, Vic |
10.10% |
|
Hobart - North East, Tas |
9.50% |
|
Huon - Bruny Island, Tas |
9.40% |
|
Surf Coast - Bellarine Peninsula, Vic |
9.20% |
|
Burnie - Ulverstone, Tas |
9.20% |
|
Heathcote - Castlemaine - Kyneton, Vic |
8.80% |
|
Ballarat, Vic |
8.80% |
|
Bourke - Cobar - Coonamble, NSW |
8.70% |
|
Devonport, Tas |
8.50% |
|
Hobart - South and West, Tas |
8.40% |
|
Barwon - West, Vic |
8.10% |
|
Woden Valley, ACT |
8.00% |
|
Campaspe, Vic |
8.00% |
|
Latrobe Valley, Vic |
7.60% |
|
Maryborough - Pyrenees, Vic |
7.20% |
|
Litchfield, NT |
7.10% |
|
Outback - North and East, SA |
6.80% |
|
Tuggeranong, ACT |
6.80% |
|
Weston Creek, ACT |
6.60% |
|
West Pilbara, WA |
6.40% |
|
Prospect - Walkerville, SA |
6.30% |
|
Barossa, SA |
6.20% |
|
Urriarra - Namadgi, ACT |
6.10% |
|
Kenmore - Brookfield - Moggill, Qld |
6.00% |
|
Tablelands (East) - Kuranda, Qld |
5.80% |
|
Hobart Inner, Tas |
5.80% |
|
Adelaide Hills, SA |
5.60% |
|
Upper Goulburn Valley, Vic |
5.40% |
|
Maitland, NSW |
5.40% |
|
Gold Coast Hinterland, Qld |
5.30% |
|
Mildura, Vic |
5.30% |
|
Charles Sturt, SA |
5.30% |
|
Gympie - Cooloola, Qld |
5.10% |
|
Centenary, Qld |
5.00% |
|
Central Highlands, Qld |
4.90% |
|
Caboolture Hinterland, Qld |
4.90% |
Top 50 regions for value declines
|
Region |
Value decline (as a percentage) |
|
Swan, WA |
-7.60% |
|
Esperance, WA |
-7.60% |
|
Maroondah, Vic |
-7.60% |
|
Canterbury, NSW |
-7.70% |
|
Marrickville - Sydenham - Petersham, NSW |
-7.70% |
|
Auburn, NSW |
-7.80% |
|
Campbelltown, NSW |
-7.90% |
|
Bunbury, WA |
-8.00% |
|
Penrith, NSW |
-8.20% |
|
Daly - Tiwi - West Arnhem, NT |
-8.40% |
|
Manly, NSW |
-8.40% |
|
Wheat Belt - South, WA |
-8.50% |
|
Wollongong, NSW |
-8.50% |
|
Kogarah - Rockdale, NSW |
-8.60% |
|
Bringelly - Green Valley, NSW |
-8.60% |
|
Gladstone, Qld |
-8.60% |
|
Knox, Vic |
-8.60% |
|
Augusta - Margaret River - Busselton, WA |
-8.90% |
|
Biloela, Qld |
-9.20% |
|
Innisfail - Cassowary Coast, Qld |
-9.40% |
|
Glen Eira, Vic |
-9.40% |
|
Mount Druitt, NSW |
-9.40% |
|
Whitehorse - East, Vic |
-9.50% |
|
Blacktown - North, NSW |
-9.60% |
|
Manningham - West, Vic |
-9.70% |
|
Rouse Hill - McGraths Hill, NSW |
-9.80% |
|
Ku-ring-gai, NSW |
-9.90% |
|
Mid West, WA |
-10.10% |
|
Bankstown, NSW |
-10.30% |
|
Bayside, Vic |
-10.30% |
|
Merrylands - Guildford, NSW |
-10.70% |
|
Liverpool, NSW |
-10.70% |
|
Cronulla - Miranda - Caringbah, NSW |
-10.80% |
|
Carlingford, NSW |
-10.80% |
|
Sutherland - Menai - Heathcote, NSW |
-10.90% |
|
Parramatta, NSW |
-11.10% |
|
Botany, NSW |
-11.20% |
|
Baulkham Hills, NSW |
-11.20% |
|
Ryde - Hunters Hill, NSW |
-11.30% |
|
Hawkesbury, NSW |
-11.30% |
|
Boroondara, Vic |
-12.20% |
|
Whitehorse - West, Vic |
-12.40% |
|
Hornsby, NSW |
-12.50% |
|
Canada Bay, NSW |
-12.60% |
|
Darling Downs (West) - Maranoa, Qld |
-14.00% |
|
Stonnington - East, Vic |
-14.10% |
|
Dural - Wisemans Ferry, NSW |
-14.20% |
|
Pennant Hills - Epping, NSW |
-14.20% |
|
Far North, Qld |
-14.50% |
|
Outback - South, Qld |
-15.60% Tags:
You need to be a member to post comments. Become a member for free today!

More from this writer: |